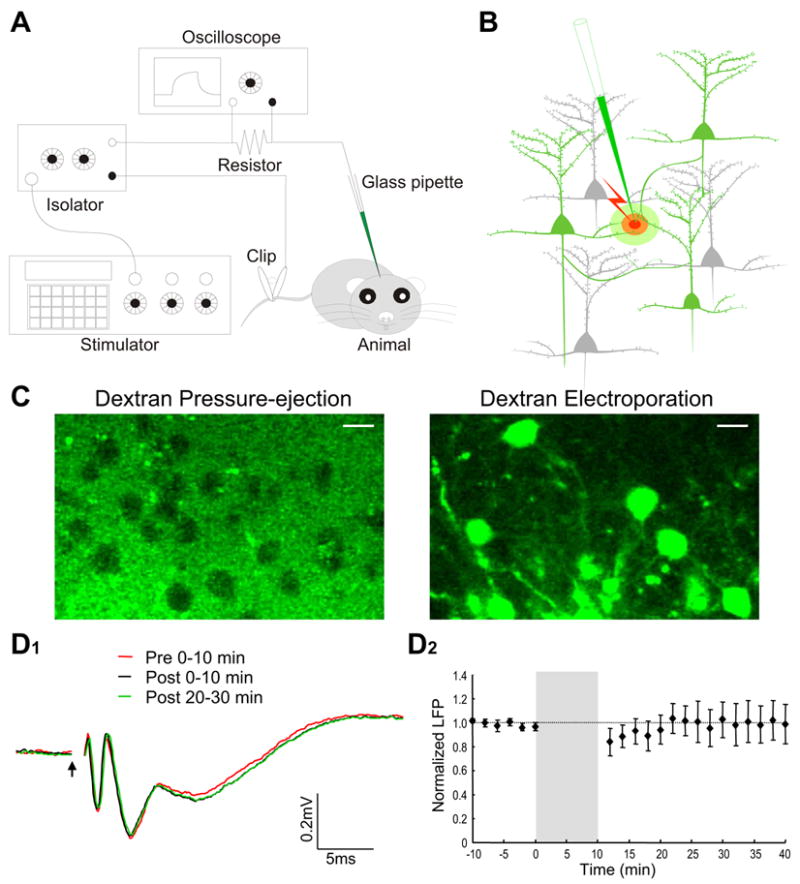
Figure 1.

Equipment setup, dye loading mechanism and evaluating disruptive effect of electroporation on network function. A, Schematic diagram showing the experimental setup. An electric circuit, consisting of a pulse generator, a current-output isolator, a series resistor, a Ca2+ dye-filled glass pipette, an anesthetized animal and a metal clip attached to the mouse tail, was used for local electroporation. The waveform and amplitude of current pulses were monitored on an oscilloscope by measuring the voltage drop across a 100-KΩ resistor. B, Schematic illustration of how Ca2+ indicators are loaded to visualize local neuronal circuits. Cell membrane in close vicinity of the pipette tip was transiently ruptured by electric current pulses, and Ca2+ dyes were electrophoresed into the axons and dendrites that passed through a small effective dye-loading area. The loaded dyes were then transported or simply diffused along axons and dendrites to visualize the entire-neuron morphology. C, Evidence for the critical involvement of membrane electroporation in dextran dye labeling. Left panel, loading dextran dye into the barrel cortex simply by pressure ejection (6 psi, 5 sec) did not lead to successful neuronal labeling. Right panel, loading the same dextran-dye solution by electroporation led to the labeling of many neurons with both soma and processes visualized. The two images were taken at three hours after loading with 10% dextran-conjugated Calcium Green-1 (CG-1). Scale bar, 10 μm. D1, Local field potentials recorded in the olfactory bulb external plexiform layer before and after electroporation. Field potentials were evoked by electric stimulation of the lateral olfactory tract. The first negative peak at 1–3 ms after the stimulus onset (arrow) indicates the antidromic activation of mitral cells, while the second and third peaks reflect the functional activation of local synaptic circuits. Three different field-potential traces are superimposed for comparison, which are average of the recordings made, respectively, at 0–10 min before and 0–10 or 20–30 min after electroporation. D2, Plotting over time the normalized amplitude of the second negative peak before and after electroporation. The shaded area indicates 10-min electroporation. Field potentials were first normalized as percentage of the mean baseline amplitude before electroporation, and were then averaged across different experiments. Each data point is presented as mean±SEM.
