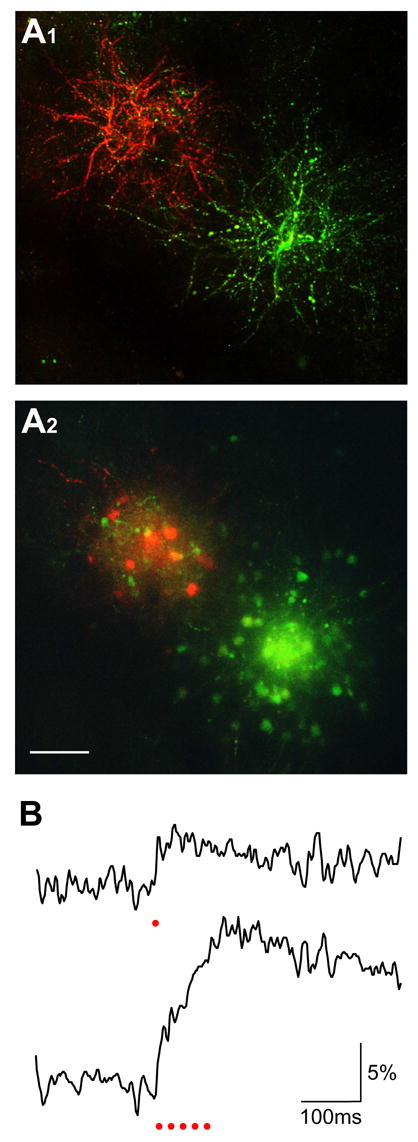
Figure 5.

Electroporation using regular salt-form Ca2+ dyes. A, In vivo two-photon imaging of the barrel-cortex neurons labeled by two separate electroporations using 5% CG-1 hexapotasssium and 5% X-rhod-1 tripotassium, respectively. The loading parameters were both -3 μA current amplitude, 25 ms pulse duration and 1200 pulses delivered at 2 Hz. A1 shows the z-projection of labeled dendrites imaged at a depth range of 50 to 115 μm below the pia. A2 is the z-projection of images between 185 and 250 μm, showing the labeled cell bodies. Scale bar, 50 μm. B, Ca2+ responses of a neuron labeled with CG-1 hexapotassium salt. The two traces show the responses to one (upper) and five (lower) electric stimuli as indicated by red dots. For each trace, five imaging trials were averaged.
