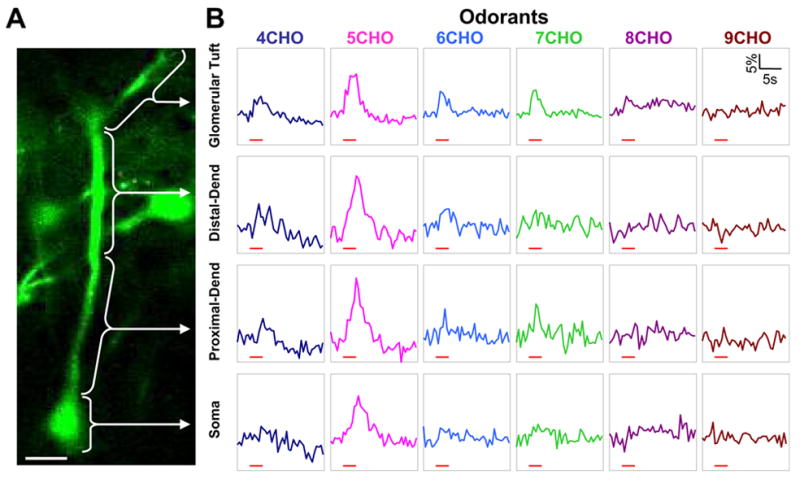
Figure 7.

Imaging odor-evoked Ca2+ response along the mitral cell soma-primary dendrite axis. A, A labeled mitral cell with its soma, primary dendrite trunk and glomerular tuft branches visualized within the same imaging plane. Ca2+ responses were analyzed respectively in the glomerular tuft branches, the distal and proximal primary dendrite trunk, and the soma. Scale bar, 25 μm. B, Odor-evoked Ca2+ increase was imaged at 2 Hz in frame-scan mode and subsequently measured in the four subcellular compartments as indicated in A. Aliphatic aldehydes with different carbon-chain length were delivered to activate olfactory sensory input. In each vertical column are Ca2+ responses in the different compartments to the same aldehyde stimulus, and each row shows the responses to different aldehydes within a certain compartment. Red bars under each trace indicate the timing of odor delivery.
