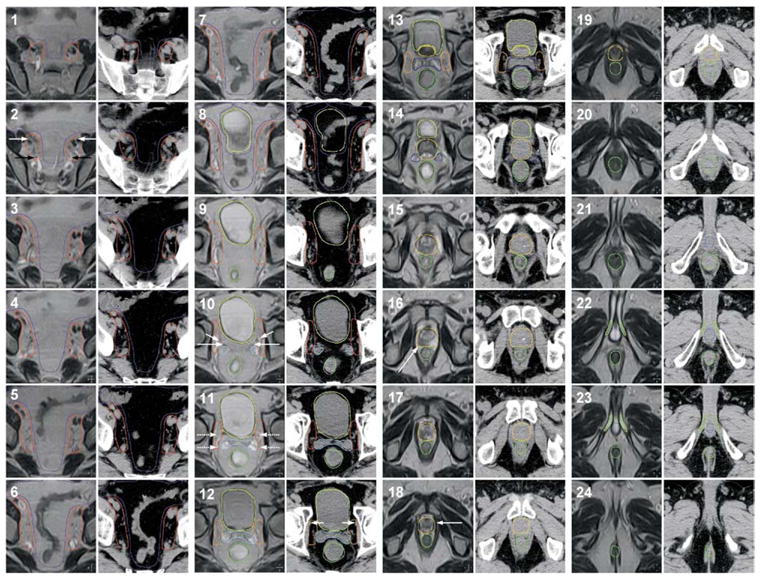
Fig. 1.

Illustration of the target and normal tissue volumes. Magnetic resonance and computed tomography images were obtained at 3-mm intervals and fused. Every other image slice (every 6 mm) is displayed. The structures outlined are displayed as follows: urinary bladder, yellow; rectum, dark green; prostate, orange; proximal seminal vesicles, dark blue; distal seminal vesicles, light blue; periprostate lymph nodes, mustard; pelvic lymph nodes, red; bowel (area of potential small bowel and distal colon/sigmoid), purple; penile bulb, royal blue; corporal bodies, light green. The following structures are labeled: external iliac vessels (panel 2, white arrow); internal iliac vessels (panel 2, black arrow); ureter (panel 10, short white arrow); vas deferens (panel 10, long white arrow); vesicoprostatic venous plexus (panel 11, dashed white arrow); obturator vessel (panel 12, short white arrow); intraprostatic mass (panel 16, long white arrow); prostatic apex (panel 18, arrow).
