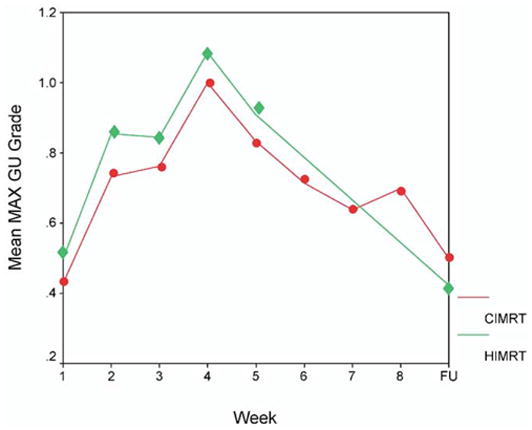
Fig. 2.

Mean maximum genitourinary (GU) toxicity is plotted by week of treatment. The y axis is scaled from 0 to 1.2. The toxicity at the 3 month follow-up is displayed at the far right on the x-axis (labeled FU). The conventional fractionation intensity-modulated radiation therapy (76 Gy in 38 fractions; solid circles) patients are compared with the hypofractionation intensity-modulated radiation therapy (70.2 Gy in 26 fractions; solid diamonds) patients. CIMRT = conventional fractionation intensity-modulated radiation therapy; HIMRT = hypofractionated intensity-modulated radiation therapy.
