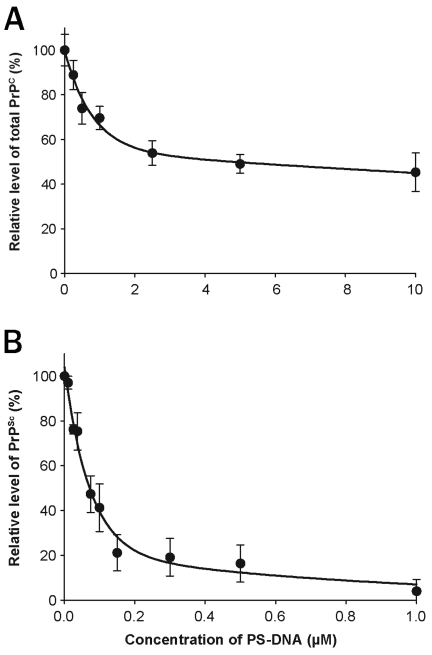
Figure 2.
Effect of the concentration of PS-DNA on PrP in ScN2a and N2a cells. Increasing concentrations of 22-mer PS-DNA are plotted against the levels of PrPC in N2a cells (A) and PrPSc in ScN2a cells after PK digestion (B). The EC50 of PS-DNA for PrPC was ~5 μM, whereas that for PrPSc was ~70 nM. These results are scans of Western blots and are the average of three independent experiments.

