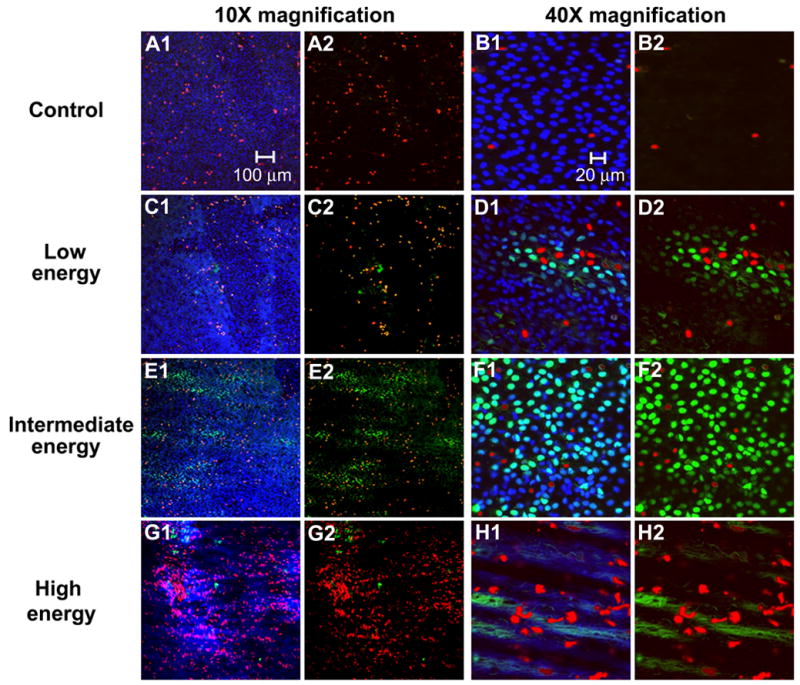
Figure 3.

Confocal microscopy images of the artery surface at 10X (A, C, E, G) and 40X magnification (B, D, G, H) showing the range of bioeffects at different ultrasound energies. Images depict (A–B) a control sample and samples exposed to ultrasound at (C–D) low, (E–F) intermediate, and (G–H) high energies. Figures A2–H2 are shown without blue fluorescence to more clearly view intracellular uptake and cell death.
