
Figure 4.
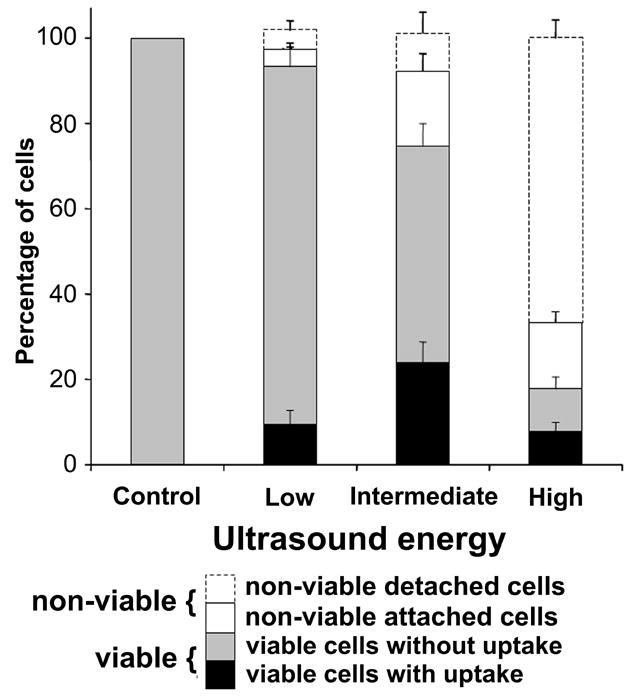
Quantification of endothelial bioeffects following ultrasound exposure. Data represent the averages of n ≥ 5 replicates with SEM shown.
Official websites use .gov
A
.gov website belongs to an official
government organization in the United States.
Secure .gov websites use HTTPS
A lock (
) or https:// means you've safely
connected to the .gov website. Share sensitive
information only on official, secure websites.
Quantification of endothelial bioeffects following ultrasound exposure. Data represent the averages of n ≥ 5 replicates with SEM shown.