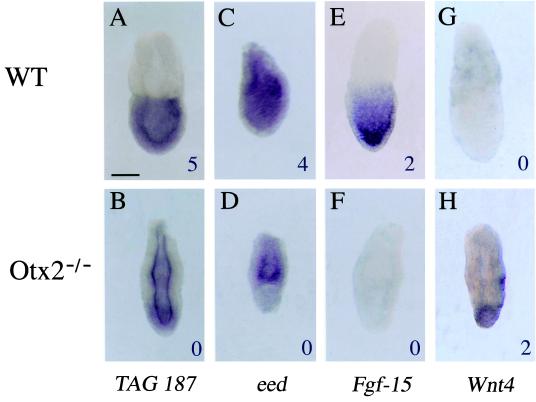
Figure 2.
Expression of mRNAs for tag 187 (Q15004), eed, Fgf-15, and Wnt4 in WT and Otx2−/− 6.5 dpc embryos. (Upper) Expression in WT embryos. (Lower) Expression in Otx2−/− embryos. Values at the lower right-hand corners of each picture give the abundance of the corresponding tag in either WT or Otx2−/− libraries. (Scale bar: 100 μm.)

