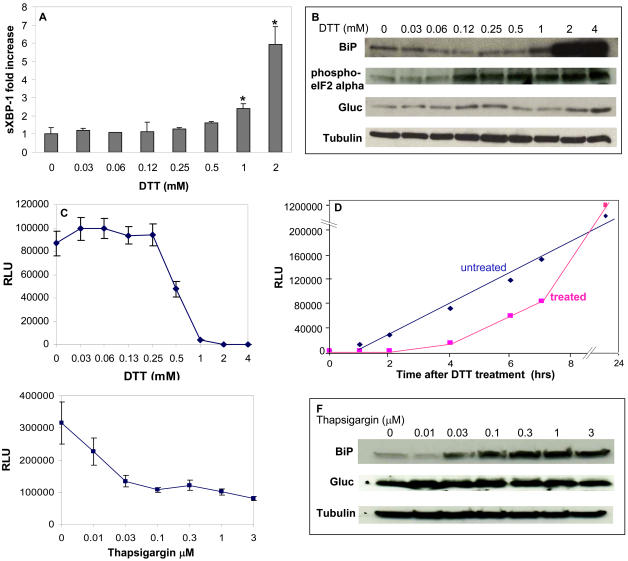
Figure 5. Monitoring of ER stress with Gluc.
293T cells expressing Gluc were subjected to no or different concentrations of DTT (A–D) or thapsigargin (E–F) to induce ER stress. (A) Real-time RT-PCR for spliced XBP-1 mRNA which increased in response to >1 mM DTT 4 hrs after treatment. Fold induction is calculated with respect to the control non-infected/non-treated cells. (B&F) Western blot analysis showing upregulation of BiP and/or phosphorylated eIF2alpha levels in response to ER stress 24 hrs after treatment. Blot is also probed with Gluc antibody as well as beta-tubulin antibody for equal loading. (C&E) Conditioned medium assayed for Gluc activity 4 hrs after DTT or thapsigargin treatment showing that Gluc secretion is decreased in response to ER stress. (D) Untreated or treated cells with 1 mM DTT were monitored overtime for the level of Gluc secretion by assaying an aliquot of the conditioned medium for Gluc bioluminescence. The mean ± S.E.M. is presented on the graphs (n = 3), with *p≤0.01 as calculated by the student's t-Test.

