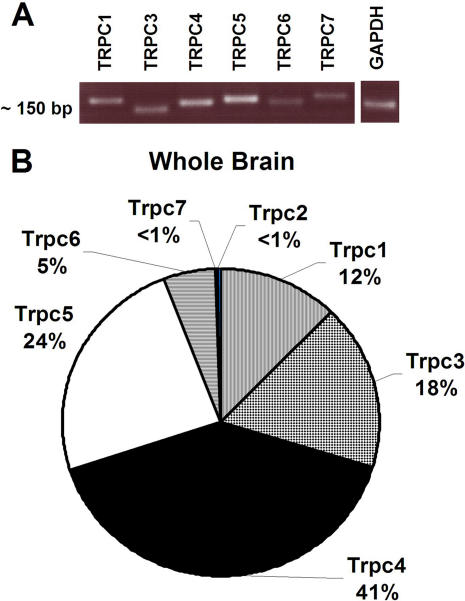
Figure 2. Expression of the TRPC channels in the rat brain.
(A) Agarose gel showing a single product from real-time PCR of the TRPC channels (B) Pie chart showing the relative expression of the seven TRPC channels in rat whole brain determined using real-time PCR. Results was normalized to GAPDH mRNA levels. (n = 4; TRPC1: Avg = 0.0012, SEM = ±0.00011; TRPC3: Avg = 0.0018, SEM = ±0.00015; TRPC4: Avg = 0.0046, SEM = ±0.00037; TRPC5: Avg = 0.0022, SEM = ±0.000356; TRPC6: Avg = 0.00055, SEM = ±0.000055; TRPC7: Avg = 0.000027, SEM = ±0.0000054)

