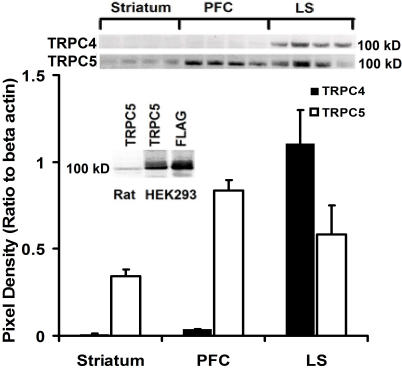
Figure 7. Region-specific expression of TRPC4 and TRPC5 protein.
Graph shows the quantification of TRPC4 and TRPC5 protein levels in the striatum, prefrontal cortex, and lateral septum in the adult rat. Results was normalized to β-actin protein levels (Top) Representative bands of the immunoblots (n = 4). (Left inset) Immunoblot of rat brain tissue lysates and TRPC5 expressing HEK293 cells blotted with α-TRPC5 and of TRPC5 expressing HEK293 cells blotted with α-Flag.

