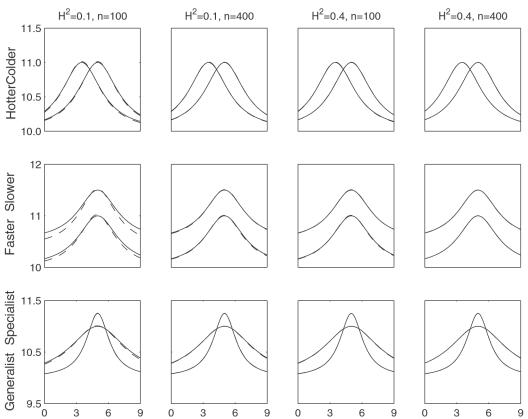
Figure 4. Estimated (solid) and given (broken) TPCs for two different QTL genotypes at different types of QTL under different samples and heritabilities.
The given curves for two different QTL genotypes are specified by  and
and  for the hotter-colder gene;
  and
and  for the faster-slower gene and
  and
and  for the generalist-specialist gene. In many cases, the estimated curves overlap with the given curves, suggesting that the model provides an unbiased estimate of TPCs. Curve parameters defined to specify three different modes of variation in TPC each controlled by a different QTL type in a backcross population.

