
Figure 3.
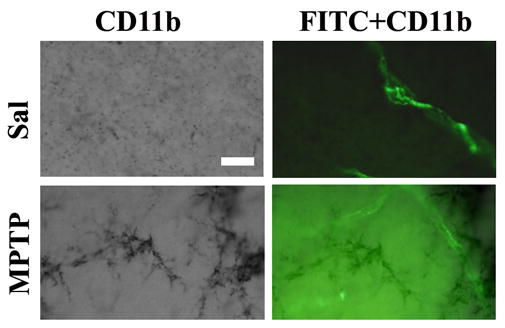
Areas of FITC-LA leakage contained activated microglia. Upper images show no FITC-LA leakage in areas of resting microglia whereas the lower row demonstrates FITC-LA leakage associated with marked microglial activation. (Bar=25um).
Official websites use .gov
A
.gov website belongs to an official
government organization in the United States.
Secure .gov websites use HTTPS
A lock (
) or https:// means you've safely
connected to the .gov website. Share sensitive
information only on official, secure websites.
Areas of FITC-LA leakage contained activated microglia. Upper images show no FITC-LA leakage in areas of resting microglia whereas the lower row demonstrates FITC-LA leakage associated with marked microglial activation. (Bar=25um).