
Figure 5.
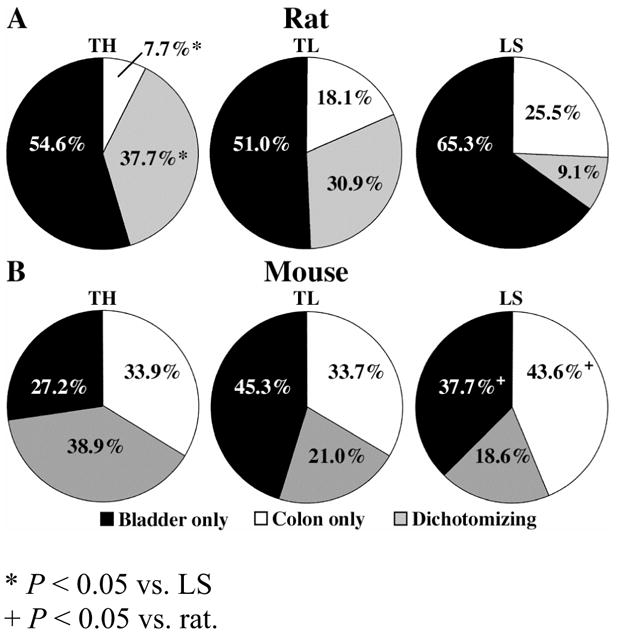
Pie graphs illustrating the percentage of TH, TL, and LS bladder-specific, distal colon-specific, and dually-labeled cells with respect to the total number of labeled cells at each respective DRG level for the rat (A) and mouse (B).
Official websites use .gov
A
.gov website belongs to an official
government organization in the United States.
Secure .gov websites use HTTPS
A lock (
) or https:// means you've safely
connected to the .gov website. Share sensitive
information only on official, secure websites.
Pie graphs illustrating the percentage of TH, TL, and LS bladder-specific, distal colon-specific, and dually-labeled cells with respect to the total number of labeled cells at each respective DRG level for the rat (A) and mouse (B).