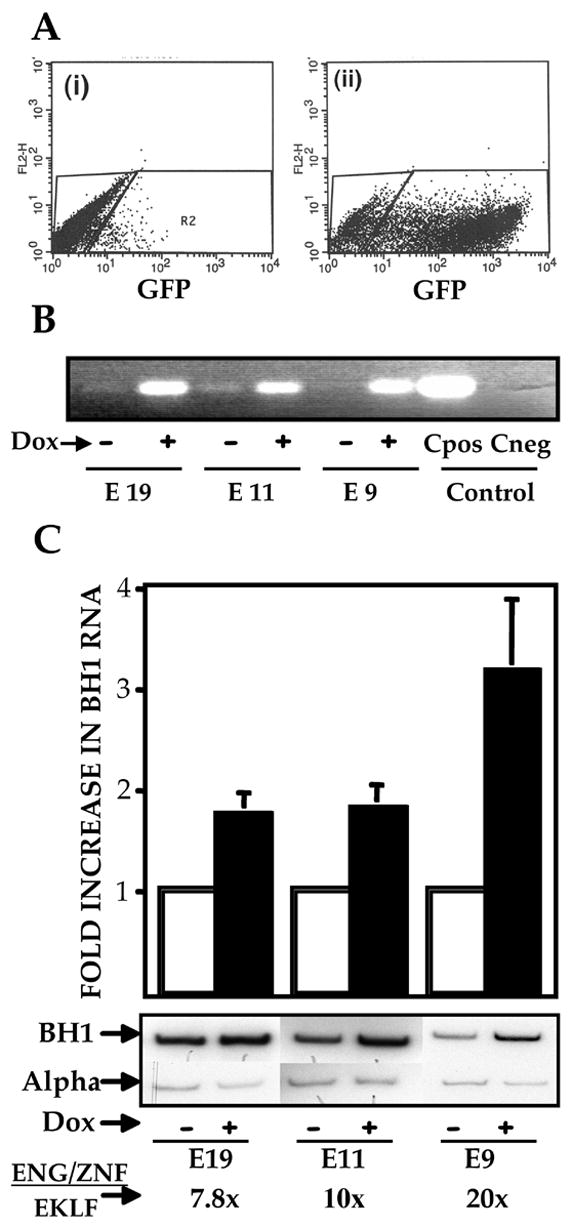
Figure 4.

(A) FACS profile of an ES cell line modified for inducible ENG/ZNF expression. i) Uninduced ES cells ii) ES cells differentiated as EBs and grown in medium supplemented with 1 mcg/ml of doxycycline. (B) ENG/ZNF RNA expression in clones E11, E19, E9. RNA was extracted from EBs grown in the absence and presence of doxycycline and subjected to RT-PCR with primers specific for engrailed cDNA. (C)Augmented βH1 expression in EBs expressing ENG/ZNF. Clones E11, E19, E9 were differentiated to EBs in the presence and absence of doxycycline. βH1 RNA levels were determined using semiquantitative RT-PCR and are depicted as fold increase from the uninduced state. Results are normalized to α globin transcripts and are an average of 3 experiments. Absolute number of molecules of ENG/ZNF and EKLF were determined by Q-PCR. The ratio of ENG/ZNF to EKLF in respective clones was thus obtained.
