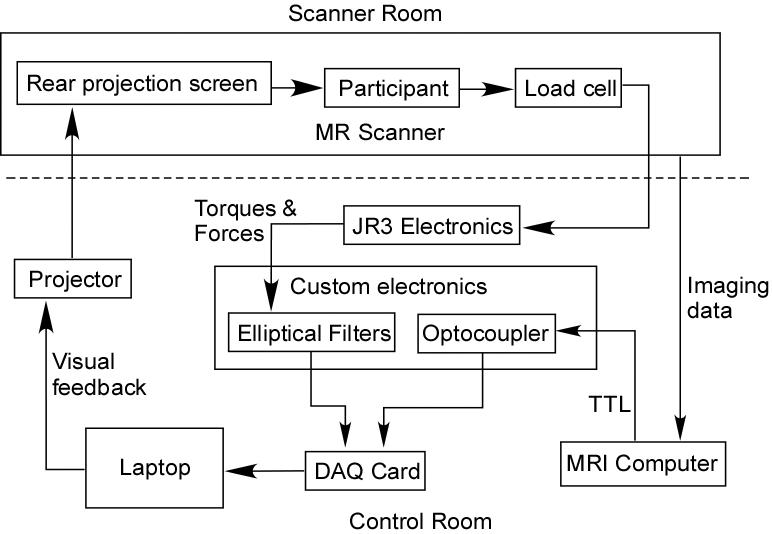
Figure 1.

Overview of the joint torque and fMRI data collection system. The participant generated isometric joint torques that resulted in endpoint force and torque data recorded by the JR3, Inc. load cell. These mechanical signals were carried into the control room where the signals were amplified and filtered by the JR3 electronics. Custom built electronics filtered the signals further and incorporated an image synchronization TTL pulse from the computer controlling the imaging data collection. These seven signals (3 torques, 3 forces, and 1 TTL) were recorded by a National Instruments data acquisition card in a laptop computer. The computer computed the joint torques from the force and torque data combined with segment lengths and arm configuration data. Visual feedback based on a single DOF joint torque was then provided to the subject via the projection/projection screen pair. The dotted line represents the radiofrequency (RF) shielding between system components inside the scanner room and those outside the magnetic environment. The optocoupler was used to eliminate electrical interference from the scanner circuitry by isolating the signal electronically.
