
Figure 3.
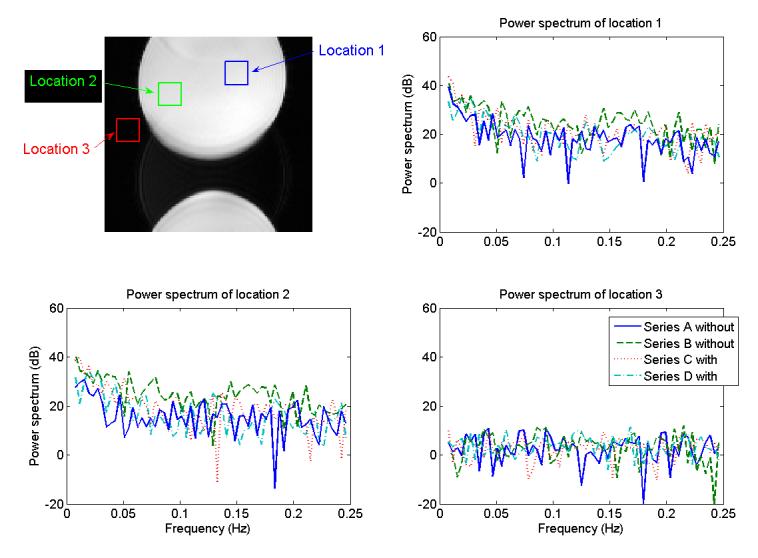
The location of the three volumes used to compare the power spectra to insure that the presence of the load cell in the MRI environment did not corrupt the MR images in a manner which might be mistaken for activation. A 15×15×11 box was averaged at each time point and the power spectra of the mean data analyzed across time after detrending the data (in other words, removing the linear trend) were calculated. Series A and B were both taken without a load cell present in the MRI and series C and D were acquired with the load cell in the MR environment. Power spectra were plotted from amplitude of the FFT calculated from the mean at each location across time after detrending the data.