
Figure 4.
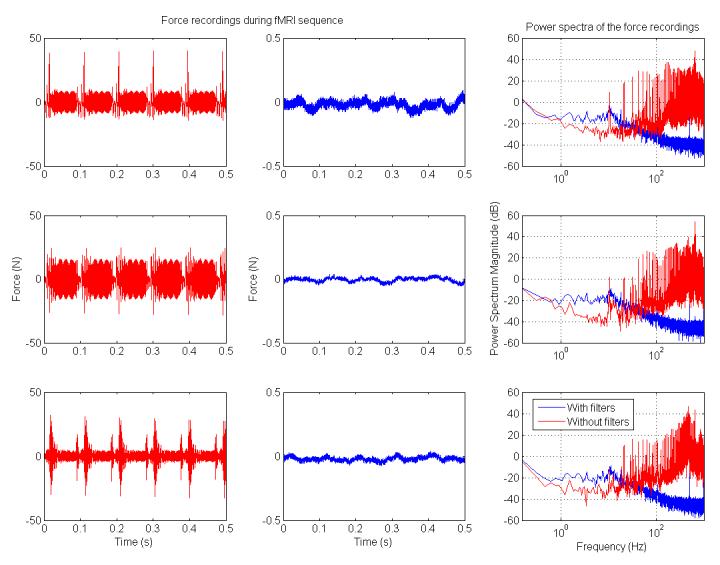
Power spectra from the load cell signal for the force during a 21-slice EPI sequence for a 120×128 matrix with TR=2000ms. Many of the frequencies recorded without filters exhibited higher power spectral magnitudes than the magnitudes of the same frequencies recorded with the filters in place. X-direction (top), y-direction (middle), and z-direction (bottom) forces were analyzed to investigate potential directional dependencies. On the left are load cell force recordings without filters, in the center are the load cell recordings with filters (note that the scale factor is different by a factor of 100, −0.5 to 0.5 N instead of −50 to 50 N on the left), and on the right are the magnitude of the power spectra of these two recordings overlaid.