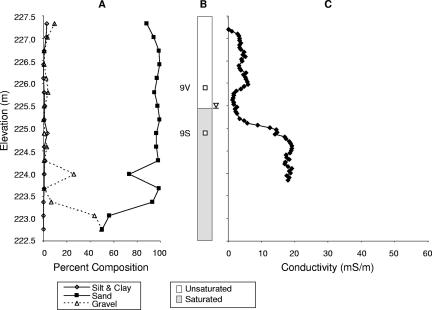
FIG. 3.
Soil lithology, soil conditions, and bulk conductivity profiles of the background site (VRP9). (A) Percentages of silt and clay, sand, and gravel. (B) Water saturation and sampling locations for 16S rRNA gene libraries 9V and 9S. The inverted triangle denotes the level of the groundwater table. (C) Levels of conductivity expressed in millisiemens per meter.

