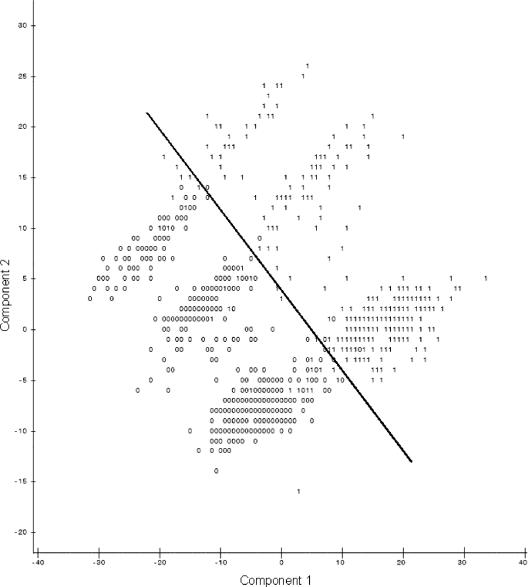
FIG. 2.
Plot of the first two principal components resulting from PCA of all 12 antimicrobial agents, with points from the high (1) and low (0) distribution peaks for nalidixic acid (the line indicates the division between high- and low-susceptibility groups). Isolate distribution patterns for neomycin, streptomycin, ampicillin, trimethoprim-sulfamethoxazole, cephalothin, gentamicin, chloramphenicol, ofloxacin, nalidixic acid, and nitrofurantoin were very similar; nalidixic acid was chosen as a representative case for graphical purposes.

