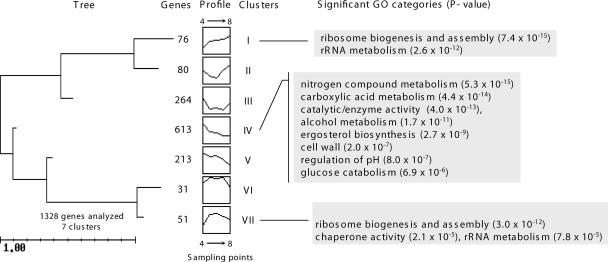
FIG. 3.
Tree obtained after clustering the significantly changed genes during the nitrogen-limiting fermentation. On the x axis are plotted the time points 4, 5, 6, 7, and 8. On the y axis are plotted the average normalized mRNA levels. Only highly significant GO categories, according to the FuncAssociate tool, are shown.

