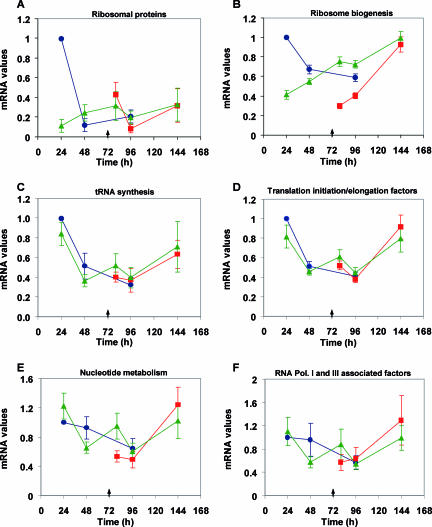
FIG. 4.
Expression profiles of ribosomal proteins (A) and RiBi regulon genes: ribosome biogenesis (B), tRNA synthesis (C), translation initiation and elongation factors (D), nucleotide metabolism (E), and RNA polymerases I- and III-associated factors (Pol. I and III) (F). Expression profiles of gene expression ratio results from mean values of the genes associated to each category compared to the reference stage (sampling point 1). •, control fermentation (267 mg of N·liter−1); ▴, N-limiting fermentation (66 mg of N·liter−1); and ▪, refed fermentation (66 + 200 mg of N·liter−1). The standard error of the mean is shown with a bar, and the arrow indicates the time of nitrogen addition.

