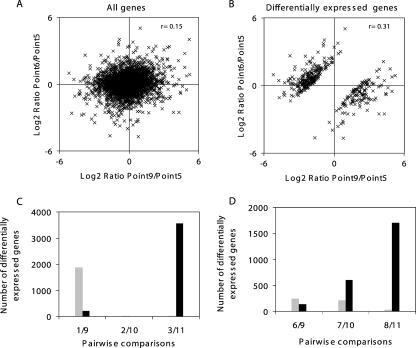
FIG. 5.
Log2 ratio scatter plots comparing expression profiles from time point 6 and time point 9 relative to time point 5 for all genes (A) and for those significantly changed (P < 0.05) between time points 6 and 9 (B). Graphical representation of the number of genes showing significant (P < 0.05) changes in pairwise comparisons between sampling points of the refed fermentation with those of the (C) control (time points 1 and 9, 2 and 10, and 3 and 11) and of the (D) N-limiting fermentation (6 and 9, 7 and 10, 8 and 11). Gray and black bars represent the number of under- and overexpressed genes at the refed fermentation sampling points (9, 10, and 11), respectively.

