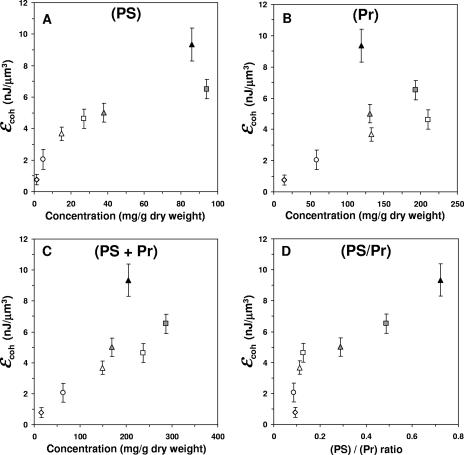
FIG. 5.
Relation between cohesive energy and the concentration profiles of polysaccharides (PS) (A), proteins (Pr) (B), their sums (C), and their ratios (D), plotted at given biofilm ages (circle symbols, 1 day; square symbols, 8 days; triangle symbols, 12 days) and depths (open symbols, ≤0.2 mm; gray symbols, 0.6 mm; closed symbols, 0.8 mm). Error bars represent the standard deviations of the means (n = 4). ɛcoh, cohesive energy value.

