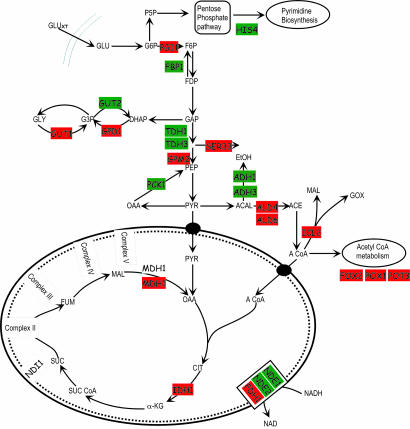
Fig. 3.
Analysis of transcription responses of NOX vs. CON superimposed on the metabolic network, as described previously (25). Shown are the key enzymes that were identified in the central metabolism as part of the subnetwork. Genes that were up-regulated are indicated in red; those that were down-regulated are indicated in green.

