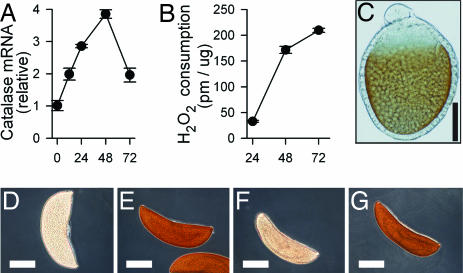
Fig. 2.
Catalase mRNA and protein expression over time in developing oocytes. (A) Relative amounts of catalase mRNA in ovaries at times PBM as measured by quantitative PCR normalizing with ribosomal protein S7. (B) Enzymatic activity of catalase in ovary homogenates from G3 females normalized for total protein in the extract. (C–G) Catalase-mediated DAB staining of whole oocytes. (Scale bars: in C, 30 μm; in D–G, 150 μm.) (C) Developing oocytes (24 h PBM) are positive for DAB staining (brown), whereas unstained oocytes are clear (not shown). (D–G) Mature oocytes (72 h PBM) accumulate catalase protein. (D) Unstained oocyte. (E) Oocyte after DAB staining (dark brown). (F) DAB staining is minimal in oocytes incubated with AT, a catalase inhibitor. (G) AT is removed by extensive washing with PBS, and DAB staining is restored, indicating that AT inhibition is reversible.

