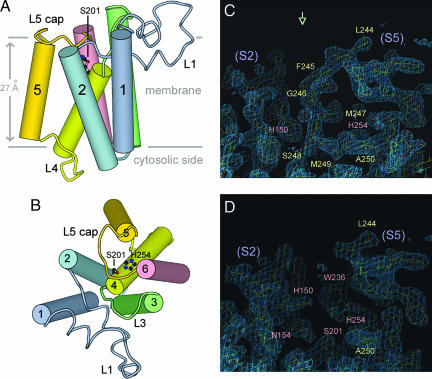
Fig. 1.
The L5 cap has become disordered. (A and B) Side and top views of GlpG, respectively. The transmembrane helices, shown as cylinders, are labeled 1–6. The two horizontal lines indicate boundaries for the hydrophobic region of the lipid bilayer. (C and D) Electron density features around L5 for the closed and open-cap structures (top view). The 2Fo − Fc maps are contoured at the 1.5σ level.

