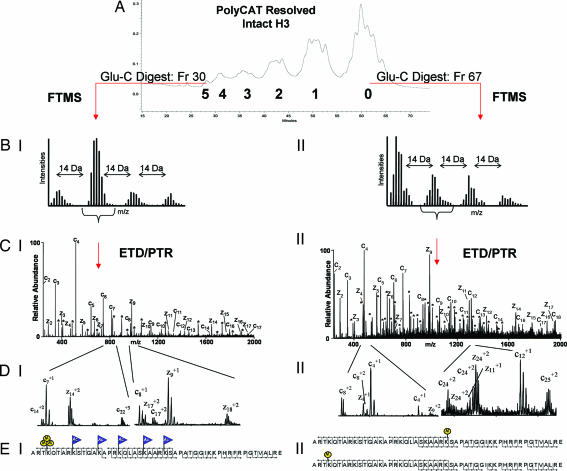
Fig. 2.
Schematic of the mass spectrometry approach. (A) PolyCAT A separation of intact histone H3. (B) FTMS mass measurements of the N-terminal H3 Glu-C peptide (H31–50). Shown are the +9 charge states of the species present in fraction 30 of group 5 (I) and the +10 charge states of fraction 67 of group 0 (II). (C) The resulting ETD/PTR zoom scan spectrum of the indicated species from groups 5 (I) and 0 (II) are shown. Singly charged c-type (containing the N terminus) and z-type fragment ions (containing the C terminus) are labeled in the spectra. Doubly charged fragment ions of type c and z are indicated by ∗. (D) Selected m/z range of the corresponding spectra displayed in C. Note the double ion series in CII. Two c4 fragment ions are observed corresponding to two H3 species; one is unmodified and one is monomethylated at K4. This ion series is traceable up to the +2 fragment ion series as shown by the two c8+2 and c24+2 fragment ions. The H3 species in this spectrum that is not methylated at K4 affords a methylation on a different residue to satisfy the FTMS measurements. The second H3 species is methylated at K27 as two z24+2 fragment ions corresponding to K27 and differing by nominal 14 Da are observed. The spectra in CII and DII correspond to two species, one monomethylated on K4 and one monomethylated on K27. (E) Sequence of H31–50. Modified residues are indicated by blue flags for acetylation (Ac) and by yellow circles for methylation (M). Peptide backbone cleavages observed in the spectra are indicated. EI shows a species trimethylated on K4 and acetylated on K9, K14, K18, K23, and K27, as interpreted from CI and DI. EII shows two species, one monomethylated on K4 and one monomethylated on K27, as interpreted from CII and DII.

