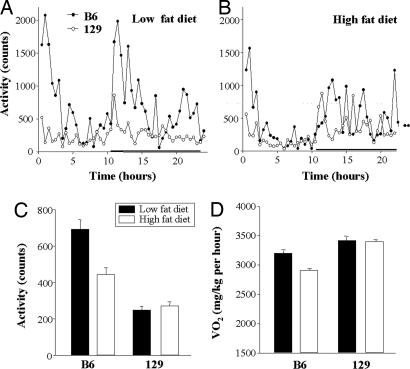
Fig. 2.
Activity and metabolic rate of B6 and 129 mice on low- and high-fat diets. Mice were placed in indirect calorimetry chambers and allowed to adapt for 48 h. Activity was measured as beam break counts during 24 h on low-fat (A) and high-fat diets (B) in B6 (filled circles) and 129 mice (open circles). The black horizontal bar denotes the dark period. (C) The bars represent the mean activity level over 24 h ± SEM with four mice in each group. Mean activity level of 129 versus B6 mice was significantly lower (P < 0.001) on both diets.

