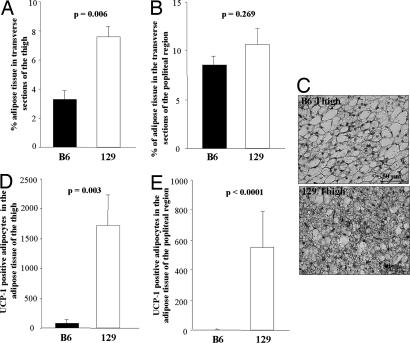
Fig. 5.
Morphology of adipose tissue from skeletal muscle of 129 and B6 mice. The bones of the posterior leg were removed from 13-week-old mice, and four transverse serial sections of the thigh (A) and three sections of the popliteal region (B) were obtained from B6 (filled bars) and 129 mice (open bars). The percentage of the area of each transverse section occupied by adipose tissue was calculated by using a morphological imaging system (see Experimental Procedures). The adipose tissue mass was significantly higher in 129 compared with B6 mice of the thigh only, as indicated on the figure. (C) A representative staining of UCP1 immunoreactive multilocular adipocytes is shown. (Scale bar, 50 μm.) Quantification of the UCP1-positive adipocytes of the thigh (D) and popliteal region (E) revealed a statistically significantly higher number of UCP1-positive cells as indicated by the P values on the figures. The bars represent the mean ± SEM of five mice of each strain maintained on regular chow at 22°C.

