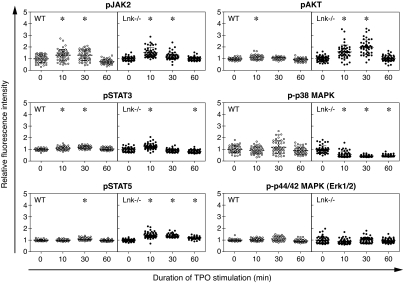
Fig. 4.
TPO-mediated signal transduction in WT and Lnk−/− CD34−KSL cells. Phosphorylation kinetics of JAK2, STAT3, STAT5, Akt, p38 MAPK, and p44/42 MAPK in TPO-stimulated WT and Lnk−/− CD34−KSL cells. All fluorescence intensities of individual cells were computationally quantified, normalized, and compared against the mean intensity of unstimulated cells. Each dot shows normalized fluorescence intensity of individual cells (n = 50). Error bars indicate mean ± SD. ∗, P < 0.001 vs. unstimulated cells (t = 0).

