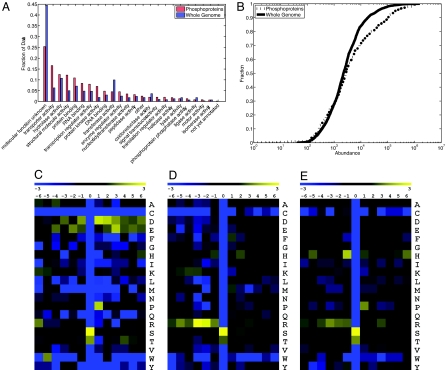
Fig. 4.
Phosphoprotein and amino acid frequencies. (A) Comparison of GO Slim (33) term frequencies between the whole genome and the phosphoproteins. (B) Comparison of protein abundances between the entire genome and the phosphoproteins. The distribution of phosphoprotein abundances is comparable to that of the genomic background. (C–E) Log2 ratios of per-site amino acid frequencies relative to the genomic background. (C) Sites identified as acidophilic by SCANSITE. (D) Sites identified as basophilic by SCANSITE. (E) Sites not recognized by SCANSITE.

