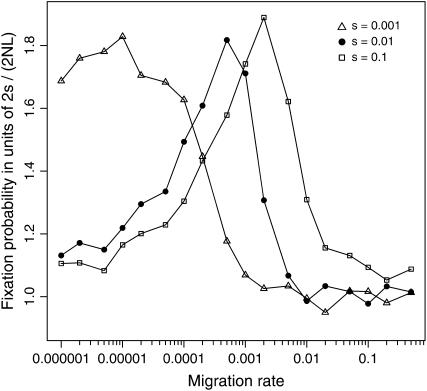
Figure 5.—
Effects of selection on the fixation probability of the coadapted haplotype A1B1 in a subdivided population. Simulation results are illustrated for s = 0.001, 0.01, and 0.1. Other parameters are N = 1000, L = 10 (NT = 10,000), c = 0.5, and T = 100. Note that the optimal migration rate mmax becomes greater with stronger selection (larger s).

