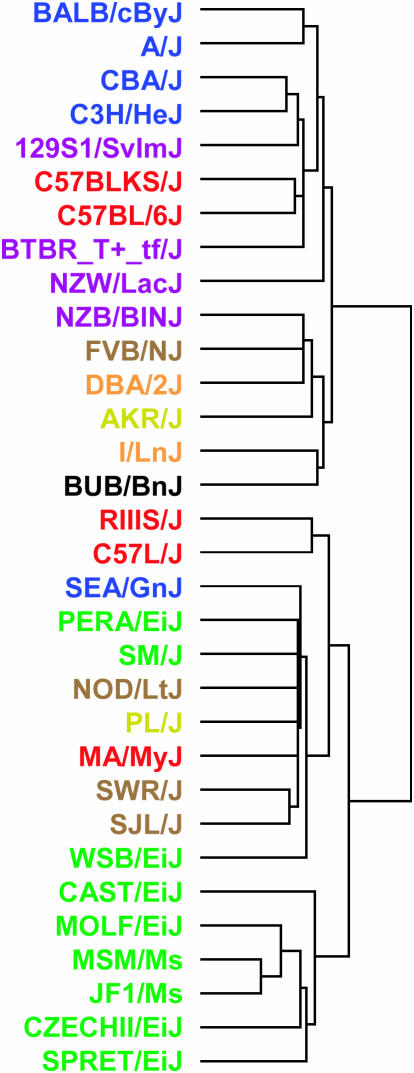
Figure 3.—
Clustering of gene expression data. The clustering dendrogram displays the relationship of global gene expression patterns between strains. Coloring of the strain names reflects clusters derived from clustering of genotype data. The clear relationship between global gene expression patterns and genomewide genetic similarity underscores the need to account for population structure in association analyses.

