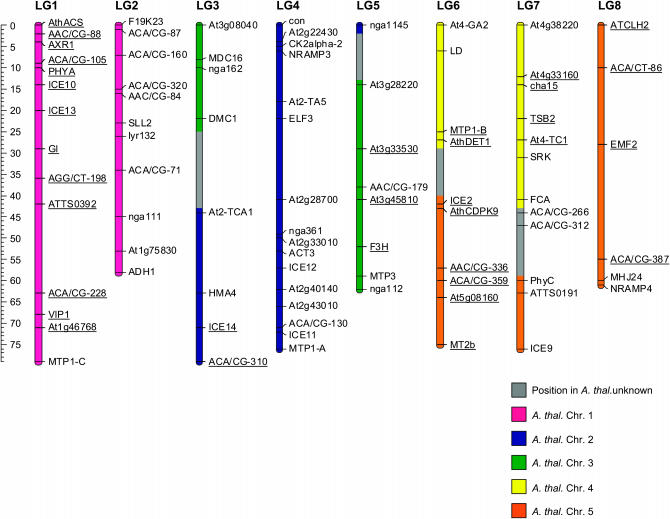
Figure 1.—
Linkage map of the A. halleri × A. l. petraea BC1 progeny constructed with Joinmap 3.0. The homology with the A. thaliana chromosomes is indicated by the colors. The regions where translocation occurred are in gray. The position in A. thaliana of the anonymous markers was inferred by integration of the A. l. petraea and A. l. lyrata mapping experiments. Markers in segregation distortion are underlined.

