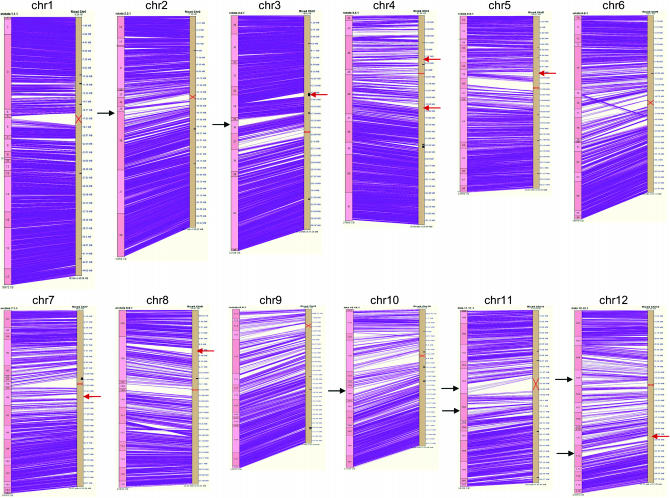
Figure 1.—
Detailed alignment view of the comparative physical map of O. punctata (BB genome type) and O. sativa (AA genome type) using SyMap (Soderlund et al. 2006). Alternating light and dark pink boxes on the left indicate O. punctata contigs. Beige bars on the right indicate O. sativa genome sequence (International Rice Genome Sequencing Project 2005). A red “X” on beige bars indicates a CentO position of O. sativa (International Rice Genome Sequencing Project 2005). Each purple line denotes the best alignment between an O. punctata BES onto the O. sativa genome sequence. The small black boxes on the beige bars indicate a physical gap in the O. sativa genome sequence (International Rice Genome Sequencing Project 2005). Black arrows indicate a position of a punctata expansion (details in Figure 2); red arrows indicate a position of a punctata contraction (details in Figure 2).

