
Figure 3. Augmented activation and expansion of donor CD8 T cells in the recipients of GKO allo-HCT.
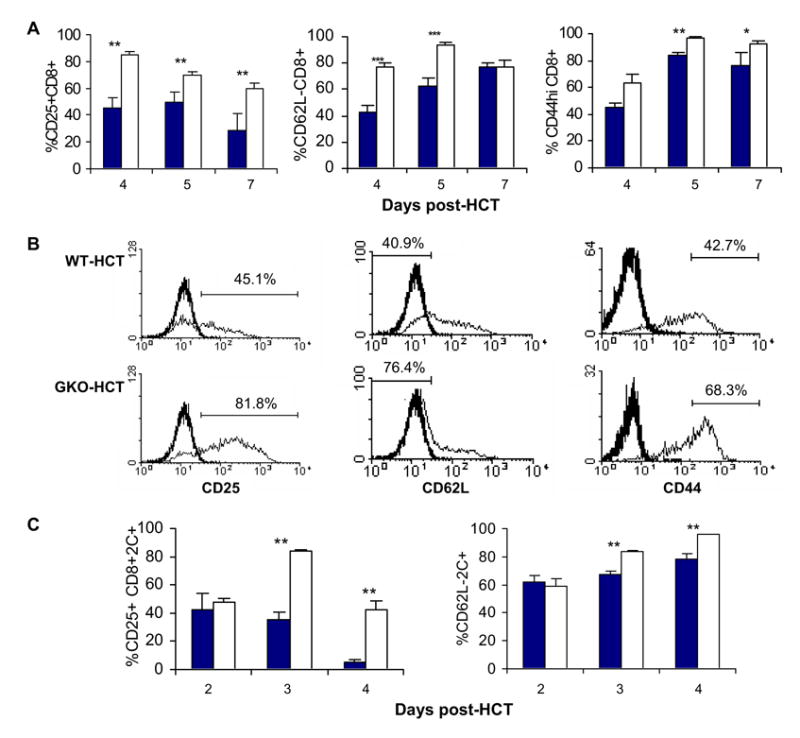
A–B: Expression of activation markers on donor CD8 T cells in the spleens of lethally-irradiated B6D2F1 mice receiving allo-HCT from WT or GKO B6 donors (n=6 per group). A. Percentages of donor CD25+, CD62L-, and CD44high CD8 T cells at the indicated time points. WT and GKO donor CD8 T cells are presented as closed and open bars, respectively. B. Representative FCM profiles showing the expression of CD25, CD62L and CD44 on gated donor CD8 T cells at day 4. Thick lines are the isotype staining controls. Analysis gates were set based on staining profiles of appropriate isotype control mAs and naïve splenocytes stained with the same mAbs at the same time. C. Spleen cells were prepared from B6D2F1 recipients of allo-HCT from WT (closed bars) or GKO (open bars) 2C donors at the indicated time points, and the percentages of CD25+ and CD62L- 2C T cells were analyzed by FCM analysis. Data are shown as mean ± SDs (n=3 per group). *, p<0.05; **, p<0.01.