
Figure 2.
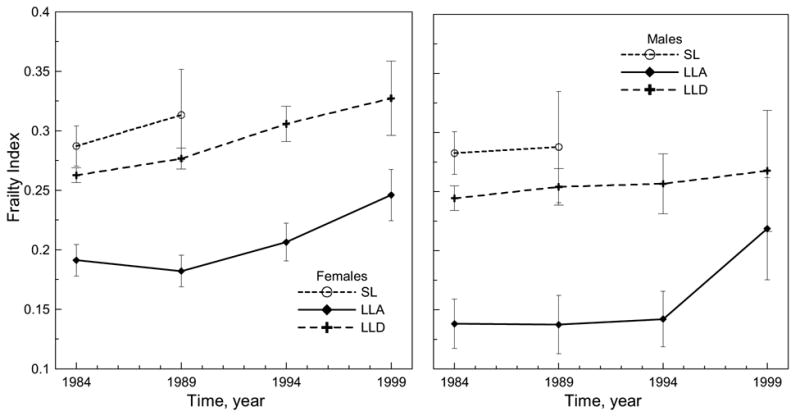
Longitudinal changes of the mean frailty index (theoretical range is between 0 and 1) for the deceased (SL and LLD) and living (LLA) females and males from the 1984 cohort. Bars show 95% confidence intervals.
Official websites use .gov
A
.gov website belongs to an official
government organization in the United States.
Secure .gov websites use HTTPS
A lock (
) or https:// means you've safely
connected to the .gov website. Share sensitive
information only on official, secure websites.
Longitudinal changes of the mean frailty index (theoretical range is between 0 and 1) for the deceased (SL and LLD) and living (LLA) females and males from the 1984 cohort. Bars show 95% confidence intervals.