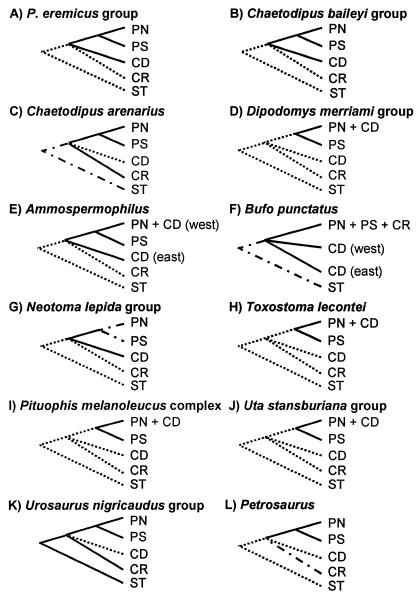
Figure 4.
Summary of postulated area relationships (see Fig. 2B) within 12 vertebrate species or species-groups inferred from distributions of mtDNA phylogroups (see Fig. 3): A–F from this study; G–L from the literature. Distinct phylogroup or taxon distributions are depicted as present (solid lines), missing (dotted lines), or unknown but postulated (dot–dash lines) in each area.

