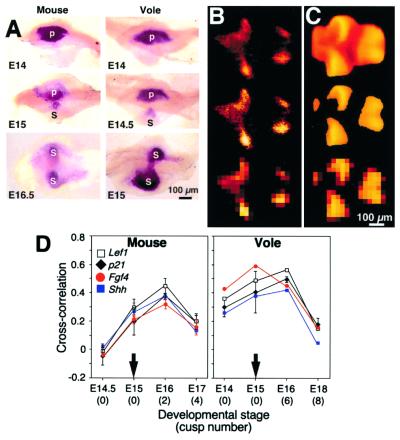
Figure 2.
Whole-mount in situ hybridization analysis of gene expression patterns and cusp topography. Shh expression in isolated tooth epithelia (A) showing the primary enamel knot (p) and the first secondary enamel knots (s). The gene expression data were digitized (B, top) and gene expression intensity of each explant was standardized (B, middle). For correlation analysis, average expression intensities in 30 μm × 30 μm squares were used (B, bottom). Cusps were delineated from DEMs (C, top and middle) and average heights in 30 μm X 30 μm squares were tabulated for correlation analysis (C, bottom). Anterior side toward the left and buccal side toward the top. (D) Cross-correlations between gene expression patterns of E15 teeth (large arrow) and shape topographies at different stages. Note how the E15 expression patterns have generally higher Spearman rank correlation coefficients (rs) with E16 than with E15 shapes. The extremely fast emergence of cusps in the vole molar (Fig. 1B) result in smaller differences between E15 and E16 correlations. This shorter lag may also be partly due to the use of mouse and rat probes on vole tissues.

