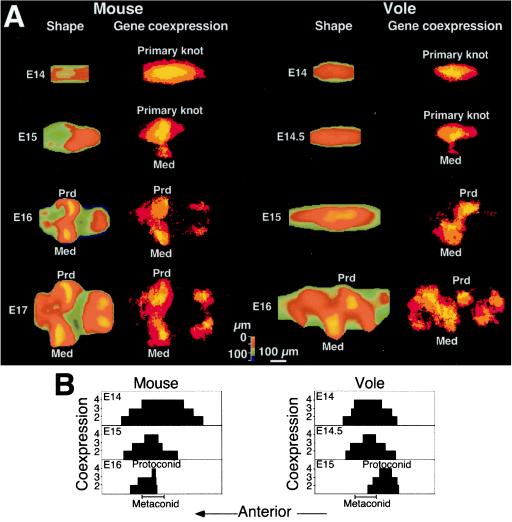
Figure 3.
GIS analysis of gene activity and topography with the two first forming cusps, the protoconid (Prd) and the metaconid (Med), labeled. (A) DEMs showing the formation of cusps and corresponding epithelial coexpression patterns of Fgf4, Shh, Lef1, and p21. The coexpression of all of the four genes (in yellow) marks the core of the enamel knots, surrounded by areas lacking Fgf4 (in orange) and Fgf4 + Lef1 expressions (in red). The cells expressing p21 (approximately the area in red) are nonmitotic, and down growth of the tooth epithelium happens outside the p21 gene expression domains. Note how the lingual secondary enamel knot for the metaconid (Med) cusp forms next to the primary enamel knot. Anterior side toward the left and buccal side toward the top. (B) A bar graph showing the nested coexpression domains of the genes in a longitudinal section through the primary enamel knot. Note how, within the primary enamel knot, the secondary enamel knot of the protoconid forms in the anterior end in mouse and in the posterior end in vole. These shifts in gene expression patterns result in a parallel cusp configuration of the protoconid and the metaconid in mouse and in a diagonal cusp configuration in vole.

