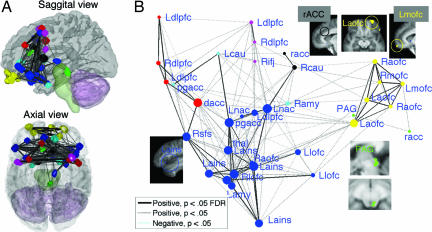
Fig. 4.
Connectivity analysis of opioid binding potential. (A) 3D rendering of connectivity among regions that show placebo opioid responses. (B) Nonmetric multidimensional scaling (NMDS) connectivity graph of the regions in A. See text for explanation. L, left; R, right; amy, amygdala; aofc, anterior OFC; cau, caudate; ifj, inferior frontal junction; lofc, lateral OFC/inferior frontal border; mofc, medial OFC; thal, thalamus.

