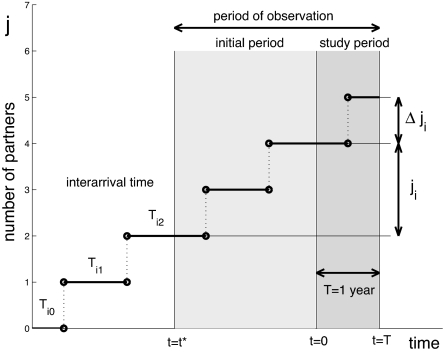
Fig. 1.
Schematics of a sample path showing the interarrival (waiting) times Ti1, Ti2. The observation period consists of two time intervals, the initial period, and the study period. The partner numbers in the first period ji are used to model the number of new partners Δji in the study period (shaded region).

