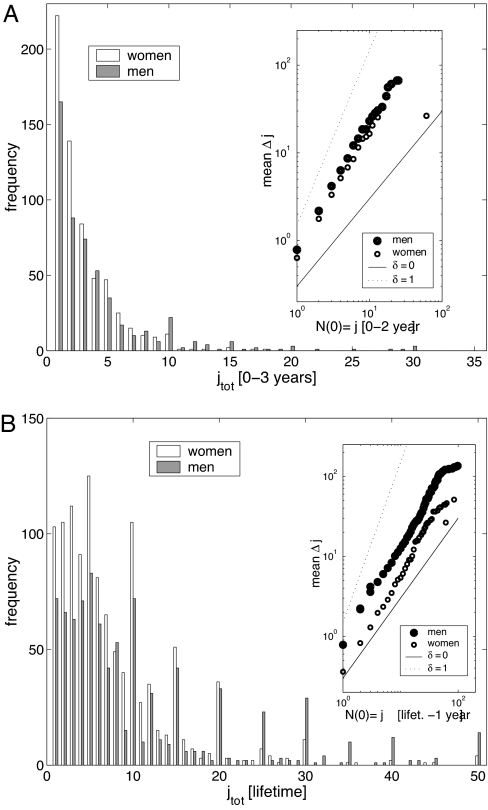
Fig. 2.
Histograms showing the distribution of total partners in the observation periods for women (white) and men (shaded) in the Norwegian survey: 3-year period (A) and lifetime (B). (A Inset and B Inset) Double-logarithmic plots of the cumulative average numbers of new partners in the 1-year study period for women (circles) and men (stars) plotted as a function of the number of partners j in the foregoing period. Thus, the mean values are group averages among all individuals having exactly j partners in the initial part of the observation period.

