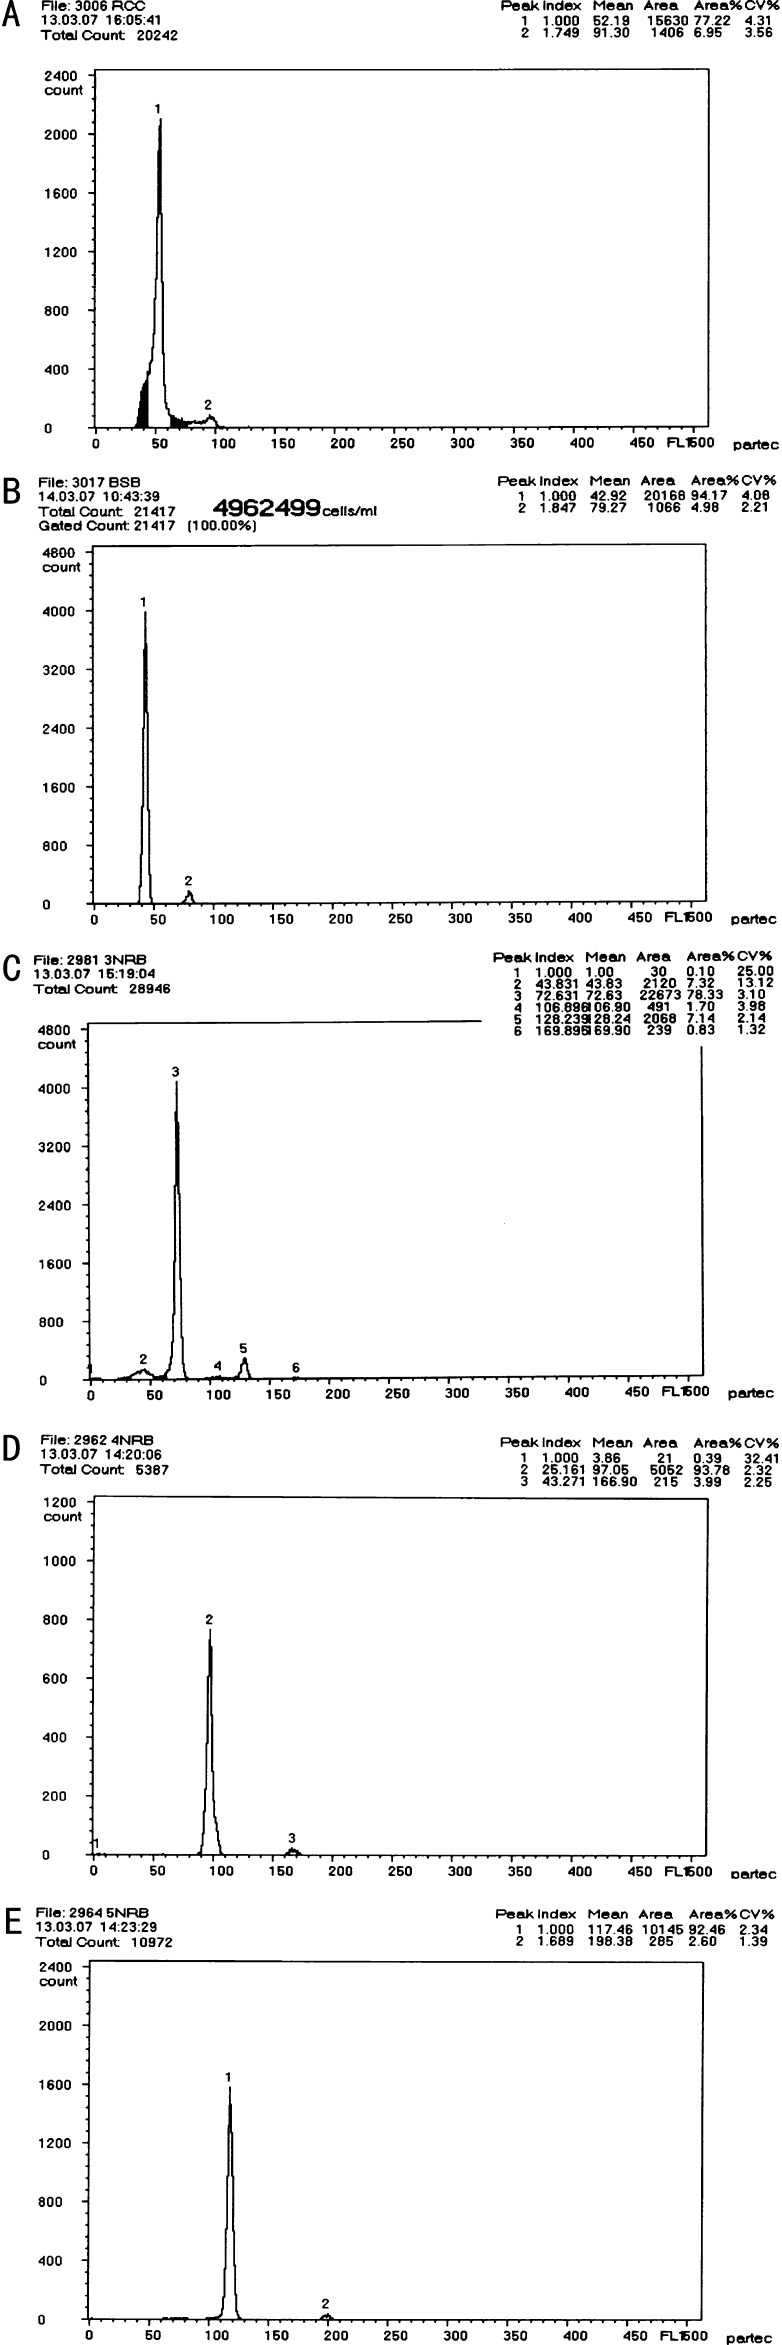
Figure 4.—
Cytometric histograms of DNA fluorescence for BSB, RCC, and polyploid hybrids. (A) The mean DNA content of RCC (peak 1: 52.19). (B) The mean DNA content of RCC (peak 1: 42.92). (C) The mean DNA content of 3nRB hybrid (peak 3: 72.63). (D) The mean DNA content of 4nRB hybrid (peak 2: 97.05). (E) The mean DNA content of 5nRB hybrid (peak 1: 117.46).

