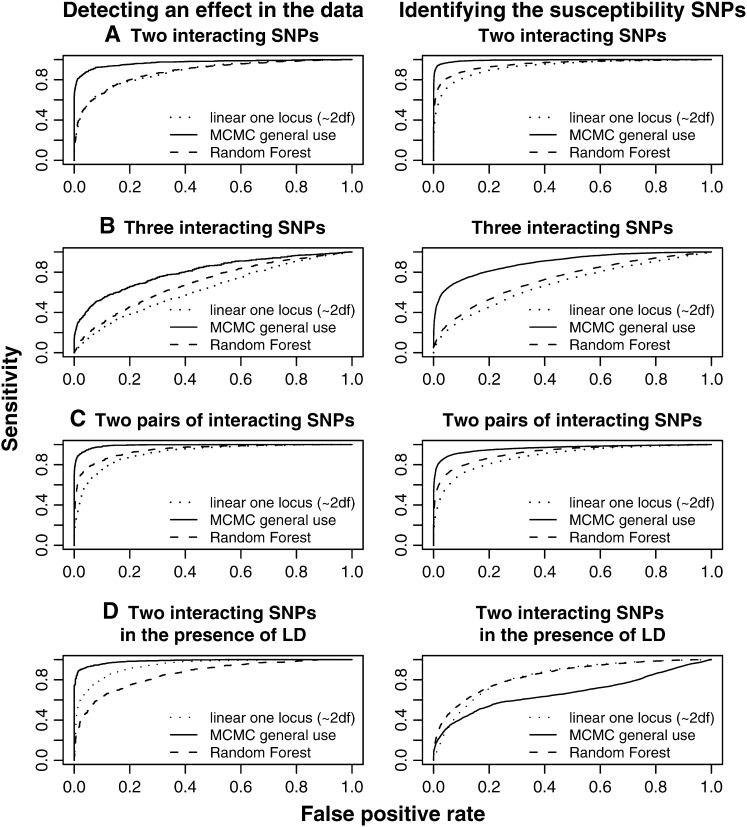
Figure 2.—
ROC curves for the three methods in epistatic genetic scenarios Each genetic scenario represents 1000 simulations of 500 individuals with 20 SNPs. The prior for the MCMC method is chosen as 
 σ ∼ U(0, ∞),
  and
and  . In all scenarios unaffected individuals have a phenotype drawn from ∼N(100, 100). (A) In this simulation the affected, drawn from N(107.5, 100), are individuals carrying at least one risk allele at two specific loci. (B) In this simulation the affected, drawn from N(107.5, 100), are individuals carrying at least one risk allele at three specific loci. (C) Affected are individuals that have at least one minor allele at one of two specific combinations of two loci. There are two possible risk combinations and four risk loci. (D) The same as in A but there is linkage between the loci.

