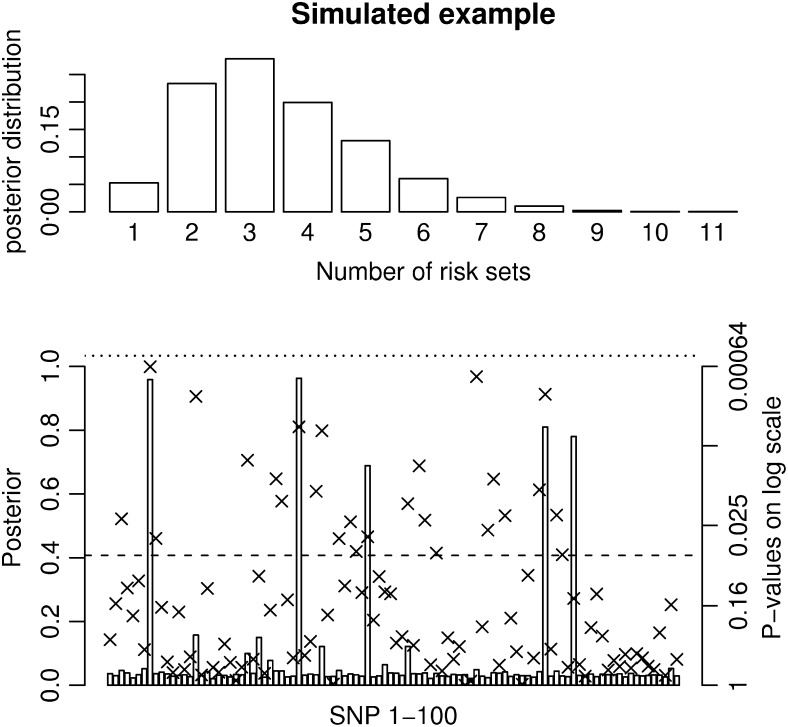
Figure 3.—
Results for a simulated scenario with 100 SNPs and 5000 unrelated individuals. Five 500,000-bp-long regions were simulated using the ms program. SNPs with a minor allele frequency of <0.05 and the SNPs in high LD (r2 > 0.95) were removed. Then 20 SNPs were randomly selected from each region and one SNP from each of the five regions with a minor allele frequency between 0.17 and 0.23 was chosen as a susceptibility SNP. Phenotypes were simulated so that the individuals with at least one minor allele at SNP8 and SNP34 had a phenotype drawn from N(103, 100) and individuals with at least one minor allele at SNP46, SNP77, and SNP82 had a phenotype drawn from N(104, 100). Individuals with minor alleles at all five susceptibility SNPs had a phenotype drawn from N(107, 100) and individuals without any of the two combinations had a phenotype drawn from N(100, 100). The prior for the MCMC method is chosen as 
 σ ∼ U(0, ∞),
  and
and  . The posterior distribution for the number of risk sets is shown at the top and the posterior probabilities for a SNP parameter being part of a risk set is shown at the bottom. Also, the P-values for the full single-locus linear model are shown as x's and the dashed and dotted lines denote P-values of 0.05 and 0.0005, respectively. The frequently sampled risk sets can be seen in Table 1.

