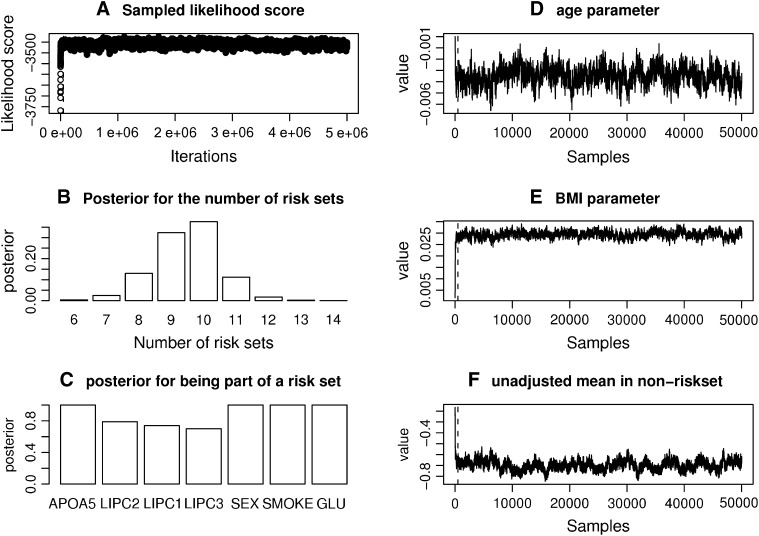
Figure 4.—
Result for the MCMC analysis of SNPs and environmental factors affecting triglyceride. A total of 5300 individuals with three SNPs and three environmental factors were tested against fasting serum triglycerides. The triglyceride levels were logarithmically transformed before testing. 
 σ ∼ U(0, ∞), nm ∼ G(0.5), and na ∼ G(0.5) but <5. The total run time was 5,000,000 with a thinning factor of 100. (A) The sampled likelihood score before removing a 50,000-iteration-long burn-in. (B) The posterior distribution of the number of risk sets. Only nonempty risk sets were counted. (C) The posterior for a parameter being part of a risk set. LIPC1 is the LIPC IVS1 + 49 C > T SNP, LIPC2 is the LIPC Ser215Asn SNP, and LIPC3 is the −514 T > C variant. GLU is the glucose tolerance status. (D and E) The values of the adjustment factors age and BMI. (F) The unadjusted mean for the individuals not placed in a risk set. The burn-in is shown as a dashed line.

