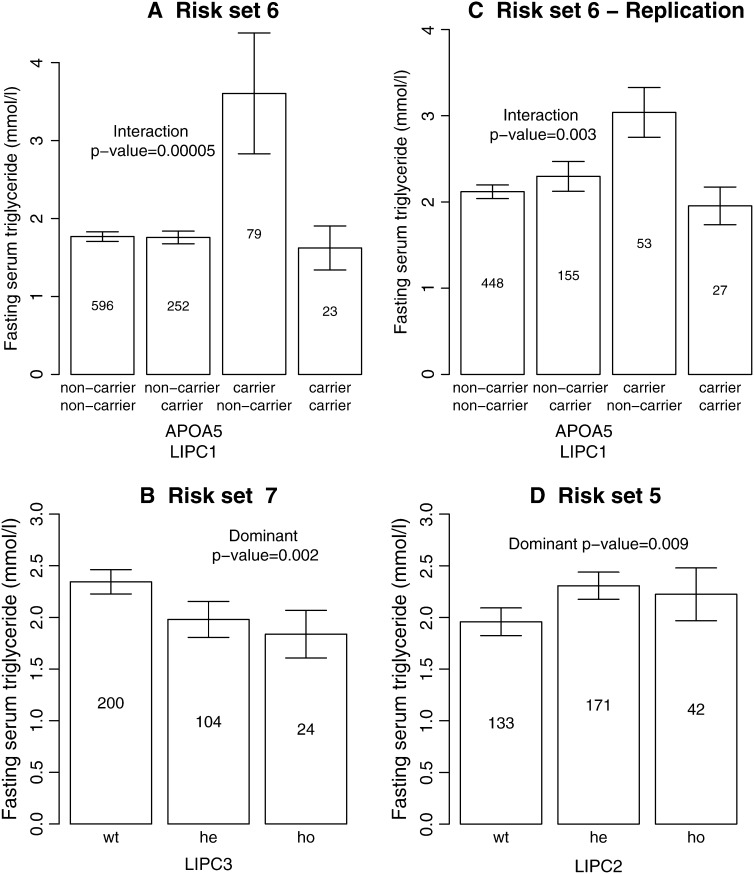
Figure 5.—
Bar plots for some of the risk sets with high posterior probability. The mean serum triglyceride levels, with standard error bars, distributed on the genotypes are shown. The cohort is stratified according to the environmental factors for the risk sets in Table 2. Due to individuals belonging to two or more risk groups, the number of individuals in the bar plot might differ from the risk sets in Table 2. The numbers in the bars represent the number of individuals with this genotype.

